
ELDER IMPULSE SYSTEM
The following excerpt was taken from “COME INTO MY TRADING ROOM, A Complete Guide to Trading” by Dr. Alexander Elder. This is an interesting momentum based system.
You can find this book at Amazon.com and it has lots of good info on various subjects.
—————————————————————————————
Begin Quote:
Entries
I designed this system to identify the inflection points where a trend speeds up or slows down. The Impulse System works in any timeframe, including intraday. It provides buy and sell signals, but leaves it up to you to select good markets, tweak parameters, and supply the discipline.
Choose an active market whose prices swing in a broad channel. What happens if you make a C trade and grab only 10% of a channel width? This result is not too bad if the channel is 20 points wide, but a C trade is an exercise in futility if the channel is only 5 points wide. Chase fat rabbits, don’t waste your time on skinny ones.
The Impulse System combines two simple but powerful indicators. One measures market inertia, the other its momentum. When both point in the same direction, they identify an impulse worth following. We get an entry signal when both indicators get in gear, but as soon as they stop confirming one another, we take that as an exit signal.
The Impulse System uses an exponential moving average to find uptrends and downtrends. When the EMA rises, it shows that inertia favors the bulls. When EMA falls, inertia works for the bears. The sec- ond component is MACD-Histogram, an oscillator whose slope reflects changes of power among bulls or bears. When MACD-Histogram rises, it shows that bulls are becoming stronger. When it falls, it shows that bears are growing stronger.
The Impulse System flags those bars where both the inertia and the momentum point in the same direction. When both the EMA and MACD-Histogram rise, they show that bulls are roaring and the uptrend is accelerating. When both indicators fall together, they show that bears are crushing the market. Those indicators may stay in gear with each other for only a few bars, but that’s when the market travels fast—the impulse is on!
Before you rush to apply the Impulse System to your favorite mar- ket, remember how Triple Screen analyzes markets in more than one timeframe. Select your favorite timeframe and call it intermediate. Multiply it by five to define your long-term timeframe. If your favorite chart is daily, analyze the weekly chart to make a strategic decision to be a bull or a bear. Use a 26-week EMA, the slope of weekly MACD- Histogram, or both, on the weekly chart.
Once you’ve defined the long-term trend, return to your daily chart and look for trades only in the direction of the weekly. The Impulse System uses a 13-day EMA and a 12-26-9 MACD-Histogram. The EMA, tracking market inertia, is a little shorter than our usual 22 bars, mak- ing the system more sensitive.
When the weekly trend is up, turn to the daily charts and wait for both the 13-day EMA and MACD-Histogram to turn up. When both inertia and momentum rise, you have a strong buy signal, telling you to get long and stay long until the buy signal disappears.
When the weekly trend is down, turn to the daily charts and wait for both the 13-day EMA and MACD-Histogram to turn down. They give you a signal to go short, but be ready to cover when that signal disappears.
Some technical programs allow you to mark price bars with different colors. Make them green when both the EMA and MACD-Histogram rise, and red when both indicators fall. Don’t mark the bars where the indicators point in the opposite directions. This lets you easily see signals at a glance.
Exits
When a cowboy at a rodeo hops on the back of a wild bronco, how long does he ride it? Twenty seconds, 35 maybe, 50 if he is good and lucky. Wild momentum trades don’t last long either. Try to hop off while you’re still in the money.
The time to buy into a momentum trade is when all your ducks are in a row, that is, when the weekly trend is up and the daily EMA and MACD-Histogram are rising. Hop off as soon as a single indicator turns down. Usually, daily MACD-Histogram turns first as the upside momentum starts weakening. When the buy signal disappears, sell without waiting for a sell signal.
Reverse the procedure in downtrends. A momentum trade on the short side starts when the weekly trend turns down and the daily EMA and MACD-Histogram also fall, showing that the downward momen- tum is accelerating. Cover shorts as soon as one of those indicators stops giving a sell signal. The most dynamic part of the decline is over, and your momentum trade has fulfilled its goal.
The Impulse System encourages you to enter cautiously but exit fast. This is the professional approach to trading, the total opposite of the amateurs’ style. Beginners jump into trades without thinking too much and take forever to get out, hoping and waiting for the market to turn their way.
You must be very disciplined to trade this system because it is hard to place an order when the market is already flying, but even harder to quit while you’re ahead without waiting for a reversal. You are not allowed to kick yourself if the trend continues after you get out. Do not touch this system if you have the slightest problem with discipline.
End Quote:
—————————————————————————————
The next excerpt regarding Elder’s Impulse System is taken from StockCharts Chart School
INTRODUCTION
The Elder Impulse System was designed by Alexander Elder and featured in his book, Come Into My Trading Room. According to Elder, “the system identifies inflection points where a trend speeds up or slows down”. The Impulse System is based on two indicators, a 13-day exponential moving average and the MACD-Histogram. The moving average identifies the trend, while the MACD-Histogram measures momentum. As a result, the Impulse System combines trend following and momentum to identify tradable impulses. This unique indicator combination is color coded into the price bars for easy reference.
Green price bars show that the bulls are in control of both trend and momentum as both the 13-day EMA and MACD-Histogram are rising. A red price bar indicates that the bears have taken control because the 13-day EMA and MACD-Histogram are falling. A blue price bar indicates a split or equilibrium between buying and selling pressure.
TIMEFRAME
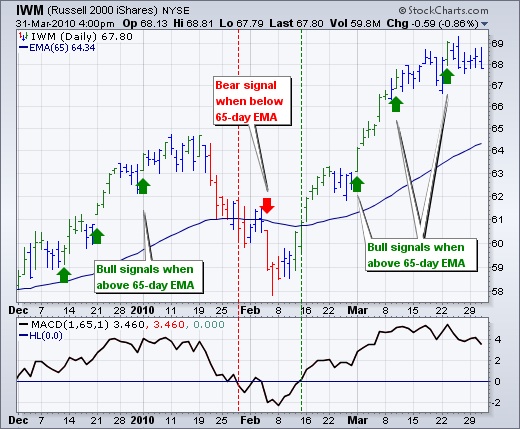
The Elder Impulse System can be used across different timeframes, but trading should be in harmony with the bigger trend. Elder recommends setting your trading timeframe and then calling it intermediate. Multiply this intermediate timeframe by five to get your long-term timeframe. Traders using daily charts for an intermediate timeframe can simply move to weekly charts for a long-term timeframe. The choice is not as clear cut for smaller or longer timeframes. A little judgment is required. Traders using 10-minute charts to chart their “intermediate” timeframe can use 60-minute charts for their “long-term” timeframe. Investors using weekly charts can base the bigger picture on monthly charts. Once the trading timeframe is decided, chartists can then use the longer timeframe to identify the bigger trend. This can even be accomplished using one chart. Chart 2 shows daily bars with the Elder Impulse System and the 65-day exponential moving average, which is five times the 13-day EMA. The long-term trend is considered up when SPY is above the 65 day EMA or when MACD (1,65,1) is positive.
ENTRIES AND EXITS
A buy signal occurs when the long-term trend is deemed bullish and the Elder Impulse System turns bullish on the intermediate term trend. In other words, the weekly chart has to show a clear uptrend in order for a daily buy signal to be valid. Daily buy signals that happen when the weekly chart is not in a clear uptrend are ignored.
A sell signal occurs when the long-term trend is deemed bearish and the Elder Impulse System turns bearish on the intermediate term trend. For example, the weekly chart has to show a clear downtrend in order for a daily sell signal to be valid. Daily sell signals that happen when the weekly chart is not in a clear downtrend are ignored.
ELDER IMPULSE SYSTEM
In the daily chart above, we are using the MACD(1,65,1) indicator to show us the weekly trend. If it is above zero, the weekly trend is up. If it is below zero, the weekly trend is down. Given that, then the first three green arrows on the chart show valid daily buy signals (i.e. new clusters of green daily bars). Note, however, that the first couple of red bars on the chart are NOT valid sell signals in this case because the weekly trend is still positive (according to the MACD we are using). The red arrow shows the first valid sell signal that happens after the weekly trend turns down. Similarly, the weekly trend must turn positive again before valid buy signals are given (as indicated by the last three green arrows on the chart).
CONCLUSIONS
The Elder Impulse System is designed to catch relatively short price moves. Elder notes the following: “The Impulse System encourages you to enter cautiously but exit fast. This is the professional approach to trading, the total opposite of the amateur’s style. Beginners jump into trades without thinking too much and take forever to get out, hoping and waiting for the market to turn their way.”
In addition to trading setups, the Elder Impulse System can be used to prevent bad trades by consulting it before entering a trade. Use the Impulse System to confirm bullish or bearish setups. Traders can ignore bullish setups when the Impulse System is not in full-blown bull mode (green bars) and ignore bearish signals when the system is not in full-blown bear mode (red bars). The impulse system can also be used to anticipate patterns or reversals. If you think a bull flag is taking shape or support from a Fibonacci retracement is near, the Impulse System can be used to identify a short-term reversal for confirmation.
—————————————————————————————
CHARTS
WAVE COUNTS SIMPLIFIED
- My wave counts are not Elliott Wave! It’s different, simple and functions without a maze of exclusions.
- There are 3 peaks (or valleys) to a completed wave count. A reversal of trend takes place after a completed wave count. Often times it’s as simple as counting 3 bumps (or dips) on a chart . . . Other times, not so easy.
- In a downtrend the same rules apply except you are counting 3 dips instead of 3 bumps.
- 3 steps must stay confined to a channel. Laying a pen or pencil on the chart will help you visualize the channel.
- As the larger trend progresses, all of the steps that make up the trend will also be confined to a larger channel. Sometimes a channel is not clear until the surge phase (vertical move) has ended.
- When the market breaks its channel (regardless of the perceived wave count), the step has been terminated. (Make sure your channel was correctly drawn before calling a termination). Sometimes this may be your best indicator that a wave count is completed.
- The correction following the second step is larger than the correction that followed the first step, and obviously the correction following third step is larger than the second step correction.
- A single wave may sub-divide into another 3 waves. I will call this an extension. When this happens (1) the trend is still intact, (2) the channel will widened and (3) instead of a total of 3 steps, there will be 5 steps.
- Sometimes I will use the terms “step” and “wave” interchangeably.
- Reading the glossary helps in the understanding of this blog. There are many other important facts in the glossary.
- Glossary Link
ABBREVIATIONS
- DJI = Dow Jones Industrials
- DJT = Dow Jones Transportations
- SPX = SP 500
- ES = SP 500 Futures
- COMPQ = Nasdaq Composite Index
- TSX = Toronto Stock Exchange (Canadian blue chips)
- SOX = Semiconductors
- TXX = Technology
************************************************************************************
- Long Term – UP
- Uptrend
- Mar 2009 To Present
- Step 2 Up (of 3) Completed
- Step 3 Up Has Possibly Begun
- From the bottom in March 2009
- Large step one up ended in May 2010
- Large step two up ended in May 2011.
- Significant break above the May 2011 highs should signal that Step 3 up is official

12-28-11 LONG TERM
************************************************************************************
- Very Long Term – DOWN
- Downtrend
- Jan 2000 To Present
- Step 2 Down (of 3) Completed
- Currently In Rally Phase From Step 2 Down

12-28-11 VERY LONG TERM
VERY LONG TERM COMMENTS
We have 3 possibilities for the future.
- We have entered a very wide swinging market (megaphone formation) similar to that of 1966 to 1974. During that era we had three bear markets with two intervening bull market rallies. Each bear market had a lower low than the previous bear. The intervening bull market rallies saw new all time highs before the next bear market began.
- We also have formed a huge head and shoulders formation since 1998. If this formation is valid, the downside measurement calls for a bottom around Dow Jones Industrials 1,000.
- We began a long term bull market in March 2009. Each subsequent min-bear market will result in higher lows than the prior major low.
- I favor the megaphone formation as the most likely scenario.
Since 2000 we have had two bear markets, 2000 to 2003 and 2007 to 2009. Like 1966 to 1974, the recovery from the first bear market saw a new all time high (2007 peak). It’s possible that we may experience another all time high during the present recovery period. This would support the megaphone formation. A failure to make new highs would support the head and shoulders argument. In both formations the conclusion of the present recovery would call for a third and final bear market. An estimated time for the conclusion of the final bear market is approximately 2018.
The lesser downside target of both formations is the megaphone formation as it likely calls for a bottom 1,000 to 2,000 points below the 2009 low, which would be around Dow 5,000.
In the head and shoulders formation the measurement calls for a bottom around Dow Jones Industrials 1,000. This is almost an unimaginable event regarding the possible fundamentals to create this scenario. If this did happen, everything that could go wrong would have to go wrong. The reasons range from the absurd to the absurdly absurd. This scenario is so dark that it doesn’t seem possible but nevertheless, the head and shoulders formation is there and will be waiting until we pierce the all-time highs of October 2007.
Remember these are simply possible scenarios and are not embedded in fact. Whatever the outcome, it never hurts to be a little cautious with some of your money. But in the worst case scenario, everything that we take for granted as being safe . . . . would not be safe. This is something to never forget in the event things go very badly.
Hopefully we will never have to think about worst case scenarios other than to have a good laugh at them presently.
************************************************************************************
EDSON GOULD
- Edson Gould, Premier Stock Market Strategist – Edson Gould had a profound influence on the development of my techniques and indicators. Prior to me subscribing to his advisory service, I was just one of the crowd.
- After 40 years I still have many of the publications from his advisory service, “Findings & Forecasts”. Fearing the loss of these hard copy reports I have recently scanned and created pdf files of these reports. Now I have hard copies and computerized versions of the reports.
- I have used a technique of his that I found in an obscure reference in one of his reports. It was only mentioned once and never again. I believe that he used this tool extensively and never told the world it’s importance. Prior to my finding this tool, I had been trying unsuccessfully to find a different way to chart the market. When I read about his technique I knew instantly that this was exactly what I had been seeking. I have charted this method back to 1939 and found it to be very useful. There is no mention of it in the reports that I posted below as I have deleted any reference to it. It’s a super secret indicator and I’d have to kill you if I told you about it.
- Edson Gould was truly a legend in his own time. It’s too bad that today most people have forgotten or never heard of him or his discoveries. Below you will find only the first page of these reports. A teaser is what you might call it. The rest of the reports are available upon request. This is a man that deserves to be remembered throughout technical analysis market history.
- The following are links to Edson Gould reports.
- My Most Important Discovery by Edson Gould
- It was also my most important discovery, for it explained the irrational volatility of markets that had mystified me in my early years. During those early years I found nothing worked in predicting these irrational market swings. But the fog lifted after reading this report and I began to understand how to begin predicting the market.
- Swing Principle by Edson Gould
- A measuring indicator
- Utilities by Edson Gould
- A forecasting indicator
- Dividends by Edson Gould
- Bonds by Edson Gould
- Speed Lines by Edson Gould
- Sentimeter by Edson Gould
- With companies failing to pay dividends commensurate with their earnings, this indicator has failed. As the market climate continues to deteriorate in the coming years, I would expect dividends to return to their former levels and this indicator will once again become useful. Prior to the late 1990s, it had 100 years of success.
- Bottoms by Edson Gould
- This was written and directed at the upcoming bottom in 1974 but it applies to all major bottoms.
- Three Steps by Edson Gould
- Where do you think my three steps principle came from? Straight from this report although I modified the concept through the years.
- Edson Gould’s 1974 Forecast
- Gould’s 1974 forecast kept me bearish and short throughout 1974 until the week before Christmas 1974, during which I began making long term purchases. After that it was ride the bull phases that transpired from 1975 to 1982. 1982 to 2000 was the greatest bull market of all time.
- Edson Gould’s 1975 Forecast
- Edson Gould’s 1976 Forecast
- Edson Gould’s 1977 Forecast
- Edson Gould’s Five Year Forecast 1977 to 1982
- This was a remarkable forecast in 1977, where the Dow Industrials had never been higher than 1,000. NO ONE predicted a rise of this magnitude in 1977. Most were waiting for a resumption of the bear market.
- As part of the 1977 to 1982 forecast: On Wednesday August 4, 1982 I went long the market for the first time in months. By Friday, August 6 I was worried that I had made a mistake as I was deep in the red (I was long the Kansas City Stock Market Contracts). The Kansas City Stock Market Contract was the first of the stock index contracts (February 1982). It was based on the Value Line Arithmetic Index, margin requirement were quite low, and it had a multiplier of 100 times the Value Line Arithmetic Index, which meant the leverage was very high. On Friday (Aug 6), my wife and I went to dinner and I told her my tale of woe and whether I should sell my long positions. I explained that my key indicator had reversed and continued higher on Thursday and Friday but the market had continued lower. Since the key indicator was usually correct, we decided to stick it out for a few days more (I was crazy in those days). My key indicator was mentioned by Gould only once in his market letters. If you didn’t catch its importance, too bad, because he only gave you a peek. Prior to Gould writing about this indicator I had been looking for one that had similar characteristics without success. Thus when Gould wrote about it, I recognized instantly that I had struck gold. I have modified this indicator slightly and researched it back to 1939. This was a lot of work as it was before computers and online data (remember when Barrons was available only on paper, still is for the distant past). Meanwhile on Monday August 9, 1982 the market took off like a rocket and never looked back. I skyrocketed out of the red and had a big profit. In August 1982 the only people that were bullish were Edson Gould, Robert Prechter and myself (probably a couple of others but I didn’t know them). Everyone else was extremely bearish. It was a perfect example of crowd behavior.
************************************************************************************
TRANSACTION SIGNALS
- All actionable signals are only for short term time frames. These signals are not designed for intermediate or long term time frames BUT . . . . .
- After a short term buy signal, long term tax status can be achieved by a continuation of the upward trend, which causes short term actions to morph into long term holdings.
- See more details in the glossary under “Taxes, Futures Contracts” and “Money Management”.
TRANSACTION RECORD
- In this blog a warning of an impending bottom (or top) is often issued well in advance of the formal buy or sell date. This allows thoughtful consideration prior to a formal action signal. To get a sense of how this works, you should read a few days prior to a formal buy/sell signal. I often buy/sell in my personal account based on the early warnings.
- The transaction record near stock market bottoms will show that I am very skittish and usually remain so until the new direction is well underway.
- Qualified buy signal given from December 5th to December 20th, 2011
- Buy signal in October 2011 was never issued due to a SERIOUS family illness
- SELL – SEPTEMBER 9, 2011
- BUY – AUGUST 30, 2011
- SELL – AUGUST 30, 2011 – Stopped out, re-bought quickly
- BUY – AUGUST 29, 2011
- SELL – AUGUST 25, 2011
- BUY – AUGUST 23, 2011
- SELL – AUGUST 1, 2011
- BUY – JUNE 23, 2011
************************************************************************************
MISCELLANEOUS
- There are useful items throughout this blog. For instance, the “Wall Street Quotes” can be very instructive. So make sure and look all through the blog.
All Rights Reserved © ™
